SQL Agent Insights:Documentation:Insight Overview: Difference between revisions
| Line 151: | Line 151: | ||
=== Pause/Resume Polling === | === Pause/Resume Polling === | ||
[[File:pause-26.png]] | [[File:pause-26.png]] | [[File:play-26.png]] | ||
At any time, active polling of your SQL Server® instance can be started and stopped with this option and indicated within the Insight status bar. | At any time, active polling of your SQL Server® instance can be started and stopped with this option and indicated within the Insight status bar. | ||
Revision as of 01:57, 7 February 2023
Main Toolbar
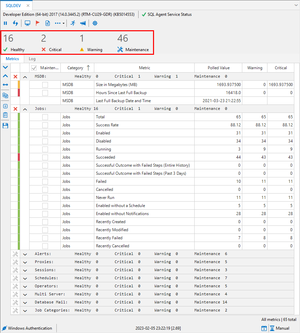
Metric Summary
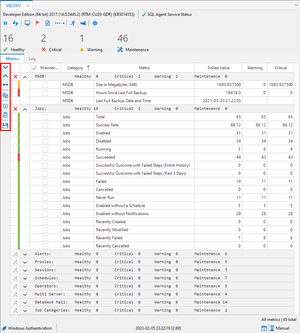
Action Bar
Metric Details
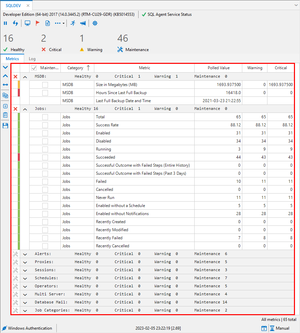 |
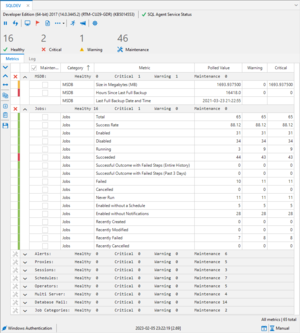
This section of an Insight is the "meat and potatoes", the focal point of an Insight. Here metrics are grouped into the following 10 categories (from top to bottom):
Here, the maintenance of each individual metric can be toggled on or off (with a simple checkbox), view the latest polled value of a metric or group of metrics, along with setting the warning and critical thresholds of each individual metric. Additionally, right-clicking on the group category will toggle the maintenance for all of the metrics in that category, and provides a quick method of doing so instead of toggling each individual metric. To understand all of the metrics and their specific details, navigate to the metrics page. |
Status Bar
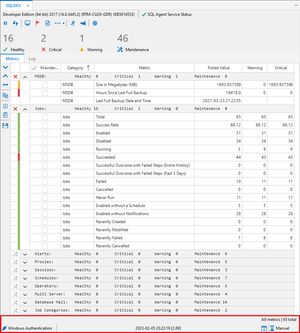 |
Located at the bottom of each Insight, the status bar showcases the following:
|
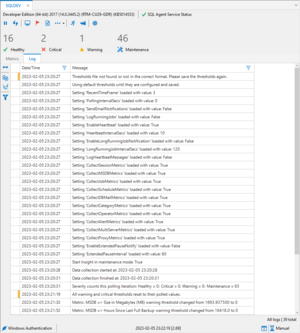
Insight Log
Toolbar Options
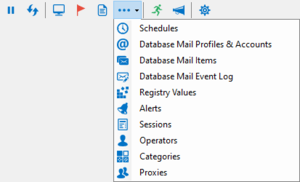
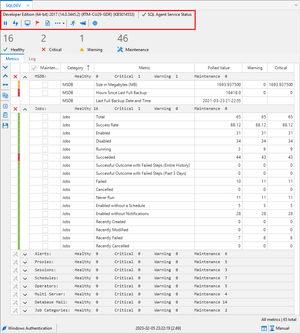
An Insight toolbar has all of the options when working with the monitored instance of SQL Server®. From left to right, they are:
Pause/Resume Polling
At any time, active polling of your SQL Server® instance can be started and stopped with this option and indicated within the Insight status bar.
 Refresh Metrics via a Manual Poll
No matter what option is selected for the polling interval, the refresh button will instantiate a connection to your monitored SQL Server® instance and update the metrics at any time refreshing all values to the most recent.
 Job Monitor
Aside from the Insight, the Job Monitor will be the most used functionality for a monitored instance. The Job Monitor is a detailed window into the most useful data for each of your scheduled jobs. With more features than the default Job Activity Monitor in SQL Management Studio, monitoring your job infrastructure is intuitive and easy.
 Job Conflict Outlook
Another unique feature to SQL Agent Insight, the Job Conflict Outlook (“JCO”), allows the ability to peer into the future to see potential job run conflicts over the next 24 hours. The JCO does this by calculating all possible job runs and then determines if these conflict with any other scheduled jobs. These job run schedules are then represented in a Gantt style chart to easily see which jobs overlap. This helps in determining the optimal time to run those critical jobs without conflicts. For jobs to appear on the chart, they must:
- have a schedule,
- be enabled,
- have a frequency greater than zero (i.e. run at least once in a 24 hour period),
- be a local job (TSX type), and,
- run at a minimum every 5 minutes. (Jobs that run more frequently, typically, are quick to run, and will likely conflict with a lot of other jobs).
 Log Viewer
Another one-up compared to the log viewer provided with SQL Management Studio, SQL Agent Insight's Log Viewer shows just how large those SQL agent logs are, along with the ability to easily filter by severity or by message text to get to the root of a problem quickly.
 More Options
(which expands to the following)
 Schedules
 Database Mail Profiles & Accounts
 Database Mail Items
 Database Mail Event Log
 Registry Values
 Alerts
 Sessions
 Operators
 Categories
 Proxies

 List Running Jobs (indicator)
This icon is represented as a “running person” image. By default, this icon is blue in color when running jobs are not being logged into the Insight log. When enabled, this icon will be green in color.

 Email Notifications (indicator)
This icon is represented as a “megaphone” image. By default, this icon is blue in color when email notifications are disabled / not configured. When enabled, this icon will be green in color.
 Insight Configuration
Everything that can be set with a monitored Insight is done via the Insight Configuration dialog.
Microsoft®, Windows® and SQL Server® are registered trademarks of Microsoft Corporation in the United States and/or other countries.
Some icons courtesy of Icons8
