SQL Agent Insights:Documentation:Job History Overview: Difference between revisions
No edit summary |
m (Wikiadmin moved page SQL Agent Insight:Documentation:Job History Overview to SQL Agent Insights:Documentation:Job History Overview) |
(No difference)
| |
Revision as of 03:20, 16 October 2023
|
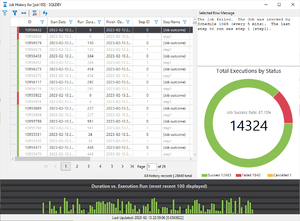
Accessing the Job History window can be done via Job Monitor, by right-clicking on a job and selecting View Job History. |
 |
Key Sections
Tool/Action Bar
Expand/collapse filters pane
- Shows / hides the filter pane. When the filter pane is collapsed and there are no filters selected, the icon will appear as an empty filter. Conversely, should there be at least one filter selected, the icon, when collapsed, will be solid in color. When the filter pane is expanded, the icon shown is a left arrow.
Clear selected filter(s)
- Clears all filters on all columns with a single click.
Size all columns to fit
- Sizes all columns (with a single click) to the size of the maximum observed cell.
Purge job history
- Opens the purge job history dialog.
Reload data from server and refresh
- Refreshes the entire Job Monitor main workspace by querying the server for updated data.
Filter Pane
- Allows a quick, one-click set of a filter for the items within the main datagrid. The filters include:
- Hide Job Steps - hides all job steps (gray in color) from the main workspace, leaving only the summary outcome of each job run.
- Hide Successful - hides all successful job steps (green row header) allowing the focus to be failed jobs for easier troubleshooting.
Main Workspace
This is the "meat and potatoes" of the Job History. Each job run and all of its steps will be shown in this datagrid. Each job step and its final outcome will have its success status represented in the row header by either a green (successful) or red (failed) indicator. If the number of items for the job history is large, multiple pages of history can by reviewed by toggling the previous/next buttons below the datagrid. The following data for each job history line item is shown:
- ID
- Start Date
- Run Duration (seconds)
- Finish Date
- Step ID
- Step Name
- Retries
- Operator E-Mailed
- Operator Paged
- Server
- SQL Message ID
- SQL Severity
- Message
- Run Status
Selected Row Message
By selecting a row in the datagrid, the Message column text will appear in the Selected Row Message pane. This makes it easier to view message text, especially when it is longer in nature. There is no need to double-click on a job (as with other products) to view the message details, making it quicker to diagnose/troubleshoot.
Doughnut Chart
The doughnut chart depicts the total number of job history executions by the selected job. In addition, the job success rate is shown along with each count of success, failed, or cancelled in the chart legend.
Duration vs. Execution Run Bar Chart
The bar chart at the bottom of the screen depicts the 100 most recent executions of the selected jobs history along with the duration of those individual runs. Hovering the mouse over any of the individual bars will show a tooltip for the individual run indicating the state of that run (color coded to match a success (green), failure (red), or cancellation (yellow)), the duration of the individual run along with the start and finish time of the individual execution.
Microsoft®, Windows® and SQL Server® are registered trademarks of Microsoft Corporation in the United States and/or other countries.
Some icons courtesy of Icons8