SQL Agent Insights:Documentation:Job Monitor Overview: Difference between revisions
No edit summary |
m (Wikiadmin moved page SQL Agent Insight:Documentation:Job Monitor Overview to SQL Agent Insights:Documentation:Job Monitor Overview) |
(No difference)
| |
Revision as of 03:20, 16 October 2023
Dissecting the Job Monitor Window
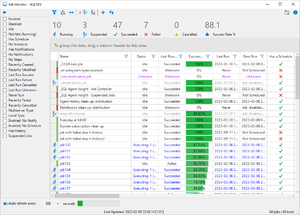
Navigating around the Job Monitor window, like the remainder of SQL Agent Insight is intuitive.
Tool / Action Bar

Expand/collapse filters pane
Shows / hides the filter pane. When the filter pane is collapsed and there are no filters selected, the icon will appear as an empty filter. Conversely, should there be at least one filter selected, the icon, when collapsed, will be solid in color. When the filter pane is expanded, the icon shown is a left arrow.
Clear selected filter(s)
Clears all filters on all columns with a single click.
Clear any/all groupings
Removes all columns put into the column header group drop area with a single click.
Size all columns to fit
Sizes all columns (with a single click) to the size of the maximum observed cell.
Show suspended/paused jobs
Suspending and resuming jobs automatically is unique to SQL Agent Insight. No other product at the time of this writing has a feature like this. Suspending a job will disable it for a given period of time, and then automatically enable the job after said time. This is ideal for jobs that do not need to be run, for example, during a maintenance window.
Should the suspend / resume controller jobs not be created on the monitored SQL instance, this button will prompt asking to create them.
Otherwise, if the suspend / resume controller jobs have already been created, pressing this button opens a new dialog showing jobs that have been suspended.
Remove custom suspend/pause jobs from server instance
For the suspend job feature to work, SQL Agent Insight requires two (2) controller jobs, one (1) schedule, and one (1) category created on the monitored instance of SQL Server. Pressing this button will remove those four items from the SQL instance. If there are jobs that are in a suspended state when the controller jobs are removed, the suspended jobs are put back to their original state as if they were resumed manually.
Create a new job
Opens the Create a new job window.
The functionality of creating a new job is very similar to creating a job within SQL Server® Management Studio (SSMS). Click here to get further detailed documentation on this feature.
Reload data from server and refresh
Refreshes the entire Job Monitor main workspace by querying the server for updated data.
Job Status Summary

Located directly above the column header group drop area is the job status summary.
This section serves two purposes:
- Gives a quick overview of job statuses from the most recent poll of the SQL instance in the following categories:
- Running - the number of jobs running.
- Suspended - the number of suspended jobs.
- Succeeded - the number of successful jobs.
- Failed - the number of failed jobs.
- Cancelled - the number of cancelled jobs.
- Success Rate % - the overall job success rate of this instance.
- Secondly, they act as quick filters.
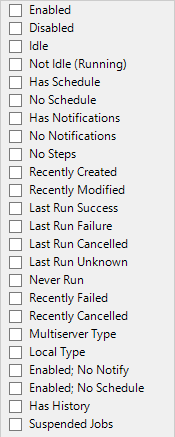
- Left-clicking on any the totals directly above their label will filter the job pane accordingly. The appropriate filter in the filter pane will be checked and as usual with set filters, they can be cleared by clicking on the Clear selected filter(s) button in the toolbar.
Tabbed / Window Button
|
In the upper-right of an Insight window, there are two buttons and hovering the mouse cursor over them will show a tooltip outlining their functionality. The rightmost button is a generic Help button. Hovering the mouse cursor over this button will give a brief tooltip reminding the user that the context menu can be accessed by right-clicking on any job. The leftmost button is the button to alter the Job Monitor window between tabbed mode and windowed mode. Depending on the setting of the preference Open Job Monitor as window, the icon will change accordingly, allowing the user to toggle window states efficiently. |
|
Filter Pane
Job Listings Pane
|
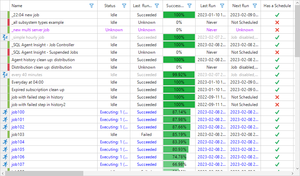
This is the "meat and potatoes" of the Job Monitor. Depending on the monitored instance, this can show quite a bit of information per job, showcasing the most important characteristics of each. Job entries are color coded for easier identification and are assigned at refresh time.
Additionally, right-clicking on any job highlights it and will bring up a context menu specific to that job. |
 |
Column Header Group Drop Area

Allows grouping the data against one or more columns. When grouping is applied, the data is organized into a hierarchical structure based on matching column values and it is sorted in ascending order.
To move a column header into the group drop area, left-click drag the desired column header and release in the group drop area.
Row Headers
Column Headers

Column headers contain the name of the column, but also may include the filter option, an icon that has the appearance of a filter. Clicking the filter icon will open a dialog allowing the grid data to be manipulated further, either showing less or more.
When a filter has been created, the filter icon will change to appear full, indicating that a filter has been set for the specified column.
To manually clear a columns filter, click on the filter icon and select the option Clear Filter from the resulting dialog.
Multiple filters can be set at once. To clear all filters easily in a single action, click the Clear selected filter(s) button in the toolbar.
Column headers are also draggable, meaning, one can change the display order if desired.
Auto Refresh Toggle

Located at the bottom left of the Job Monitor is the auto refresh toggle. Turning this on will refresh the Job Monitor automatically after the given number of seconds indicated. When enabled (active), a progress bar is shown indicating the amount of time that has passed and how much time remains prior to the next refresh.
The auto refresh dropdown has the following options; 30, 60, 120, 300, 600, 900, 1800, or 3600, of which one can be chosen. Once the duration (measured in seconds) has been selected, the timer begins and the progress bar indicates how much time has elapsed prior to refreshing.
Should a new dropdown option be chosen, the timer restarts at 0 and the progress bar clears.
Microsoft®, Windows® and SQL Server® are registered trademarks of Microsoft Corporation in the United States and/or other countries.
Some icons courtesy of Icons8


