SQL Agent Insights:Documentation:Job Conflict Outlook Overview
Key Sections
Tool/Action Bar
The following actions are available, (left to right), within the task / action bar.
Size all Columns to Fit
- Sizes all columns (with a single click) to the size of the maximum observed cell.
Toggle Grid Visibility
- Show / hide the data grid allowing more screen real estate to show the Gantt chart.
Select and Chart All Jobs with Conflicts
- A single click action to select and chart all jobs that have at least one job conflict in the # of Conflicts column.
Select and Chart All Jobs with Frequency > 0
- A single click action to select and chart all jobs that have at least one job execution in the Frequency column.
Check All Eligible Jobs
A single click action to select and chart all jobs that are eligible to be graphed (i.e. green color band in the row header).
Uncheck All Jobs
- A single click action to unselect all jobs, effectively removing them from the chart.
Reset Chart Zoom
- Resets the Gantt chart zoom level back to the default, 100% completely unzoomed. This is the same as left double-clicking the chart area or pressing the ESCape key while the chart has focus (i.e. green border).
Plot Chart with Selected Jobs
- Charts only the selected jobs in the Gantt chart. Must have at least a single job selected for this to display the chart.
Cancel Processing and Close
- Depending on the SQL Server® instance monitored, the number of jobs, and the frequency of those jobs, it may take a long time to calculate all of the potential conflicts. Pressing the cancel button will stop that processing, throw up an application exception noting that the operation has been cancelled by the user, and close the window.
Reload Data from Server and Refresh
- Reloads all data from the monitored instance and re-calculates all columns shown.
Main Workspace / Job Pane
The job grid will show all jobs that have a single schedule at the bare minimum.
|
The job grid has the following columns which can be sorted by clicking on the column header.
- Select Jobs to Chart
- A checkbox column allowing the selection of single jobs. At least one eligible job be selected to plot in the Gantt chart. Additionally, the checkbox cannot be checked if the job is ineligible to be charted, as indicated by the red color band in the row header.
- Job
- The job name.
- Schedule
- The schedule associated with this particular job.
- Frequency
- The number of job executions for this job and associated schedule over the course of the graphing period, by default, 24 hours into the future.
- # of Conflicts
- The number of job executions for this job and associated schedule that conflict with other job executions over the course of the graphing period, by default, 24 hours into the future.
- Average Run Time
- The average run time of the job and associated schedule determined from the job execution history system tables.
- Max Run Time
- The maximum run time of the job and associated schedule determined from the job execution history system tables.
- # of Historical Executions
- The number of entries for this job and associated schedule from the job execution history system tables.
Gantt Chart / Help
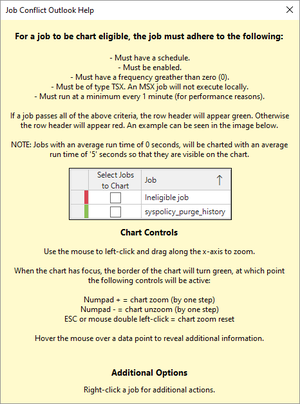
By default upon opening the Job Conflict Outlook window, no Gantt chart data is plotted. This space is temporarily used to show the help information for working with the Job Conflict Outlook window.
Additionally, by clicking the Help button in the upper-right of the window will also display a help dialog in case there is data residing in the Gantt chart.
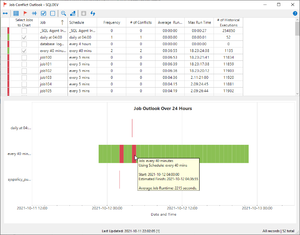
When jobs have been selected from the job grid and charted by clicking on the Plot chart with Selected Jobs button, a Gantt chart will appear showing all possible future job executions for the next 24 hours. Should the job execution conflict with another job execution, it will appear red in color, as will the offending job execution.
Hover the mouse cursor over any job execution will show a tooltip indicating the job name, the schedule that job execution is using, along with the estimated job start and job finish date and time, and the average job run time in seconds.
Hovering the mouse cursor over any job name on the vertical y-axis, will indicate the full job name (in case of truncation) along with the schedule being used for that job instance.
Chart Controls
The Gantt chart can be manipulated so that one can zoom into sections of a given time period for more precise observations / analysis. Use the left mouse button to click and drag along the x-axis to create the zoom window, which will appear blue in color. Releasing the left mouse button initiates the zoom action.
Double left-click the mouse on the chart to reset the zoom.
Once the chart has focus, (identified by a green border around the perimeter of the chart), the following controls will be active:
- Numpad + will zoom the chart (by one step)
- Numpad – will unzoom the chart (by one step)
- ESC will reset the zoom on the chart.
Additional Options
Right mouse click on any job in the chart to see additional actions.
Microsoft®, Windows® and SQL Server® are registered trademarks of Microsoft Corporation in the United States and/or other countries.
Some icons courtesy of Icons8


