SQL Agent Insights:Documentation:Log Viewer Overview: Difference between revisions
m (Wikiadmin moved page SQL Agent Insight:Documentation:Log Viewer Overview to SQL Agent Insights:Documentation:Log Viewer Overview) |
No edit summary |
||
| Line 1: | Line 1: | ||
[[SQL Agent | [[SQL Agent Insights:Documentation|Back to Documentation Main]] | ||
<hr> | <hr> | ||
{| | {| | ||
|style="vertical-align: top;"| | |style="vertical-align: top;"| | ||
The ''Log Viewer'' within ''SQL Agent | The ''Log Viewer'' within ''SQL Agent Insights'' is specifically used for viewing the SQL Agent logs of a monitored instance. | ||
|style="vertical-align: top;"| | |style="vertical-align: top;"| | ||
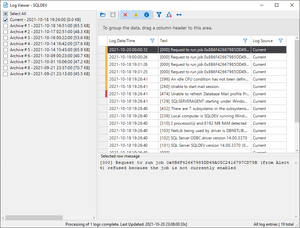
[[file: log-viewer-overview.png|thumb|right|A typical ''Log Viewer'' window.]] | [[file: log-viewer-overview.png|thumb|right|A typical ''Log Viewer'' window.]] | ||
| Line 12: | Line 12: | ||
=== List of Available SQL Agent Logs === | === List of Available SQL Agent Logs === | ||
Upon first opening the log viewer, ''SQL Agent | Upon first opening the log viewer, ''SQL Agent Insights'' determines how many agent log files are on the monitored instance and calculates their sizes. This information is then shown in the left-hand pane of the log viewer allowing one or more to be checked for viewing. | ||
=== Tool/Action Bar === | === Tool/Action Bar === | ||
| Line 64: | Line 64: | ||
<hr> | <hr> | ||
[[SQL Agent | [[SQL Agent Insights:Documentation|Back to Documentation Main]] | ||
{{MicrosoftFooter}} | {{MicrosoftFooter}} | ||
Latest revision as of 03:48, 16 October 2023
|
The Log Viewer within SQL Agent Insights is specifically used for viewing the SQL Agent logs of a monitored instance. |
 |
Key Sections
List of Available SQL Agent Logs
Upon first opening the log viewer, SQL Agent Insights determines how many agent log files are on the monitored instance and calculates their sizes. This information is then shown in the left-hand pane of the log viewer allowing one or more to be checked for viewing.
Tool/Action Bar
The toolbar contains all of the actions one can accomplish from within the log viewer. See below for more detailed information on each action.
Load Selected Log(s)
- Loads the selected log files into the main data grid for viewing.
Cancel Loading of Log(s)
- Cancels the loading of selected logs. This will result in a partial list of data shown in the data grid.
Toggle Whether Error Messages are Shown
- By default this action is enabled. When enabled, log error messages are shown in the data grid. Deselecting this option hides error messages.
Toggle Whether Warning Messages are Shown
- By default this action is enabled. When enabled, log warning messages are shown in the data grid. Deselecting this option hides warning messages.
Toggle Whether Informational Messages are Shown
- By default this action is enabled. When enabled, informational log messages are shown in the data grid. Deselecting this option hides informational messages.
Clear any/all Filter(s)
- Will clear any and all filters set by clicking on the column header filter icon . Additionally, if any of the aforementioned error, warning, or informational toggles have been disabled, doing this action will reset and enable them back to the default.
Clear any/all Groupings
- Removes all columns put into the column header group drop area with a single click.
Size all Column to Fit
- Adjusts the width of all columns in the log to the largest cell in that column.
Column Header Group Drop Area
Located just below the toolbar, the column header group drop area:
- Allows grouping the data against one or more columns. When grouping is applied, the data is organized into a hierarchical structure based on matching column values and it is sorted in ascending order.
- To move a column header into the group drop area, left-click drag the desired column header and release in the group drop area.
Main Workspace
The main workspace for the log viewer resides just below the toolbar. It contains two (2) important sections.
- Column headers.
- Which can be moved, resized, grouped and filtered.
- Individual rows of data.
- Which, when selected, will display the message text into the row message window. Additionally, error and warning rows will have a color band shown in the row header, red and yellow respectively.
Row Message Pane
- After a log has been loaded, the contents will appear in the main data grid. Subsequently selecting an individual row from the data grid will display its message text within the row message window, located directly below the main data grid.
- Moving through the rows in the data grid can be done individually by selecting them with a left-mouse button click or post initial selection, by using the up / down arrows key on the keyboard.
Microsoft®, Windows® and SQL Server® are registered trademarks of Microsoft Corporation in the United States and/or other countries.
Some icons courtesy of Icons8